


Financial Highlights
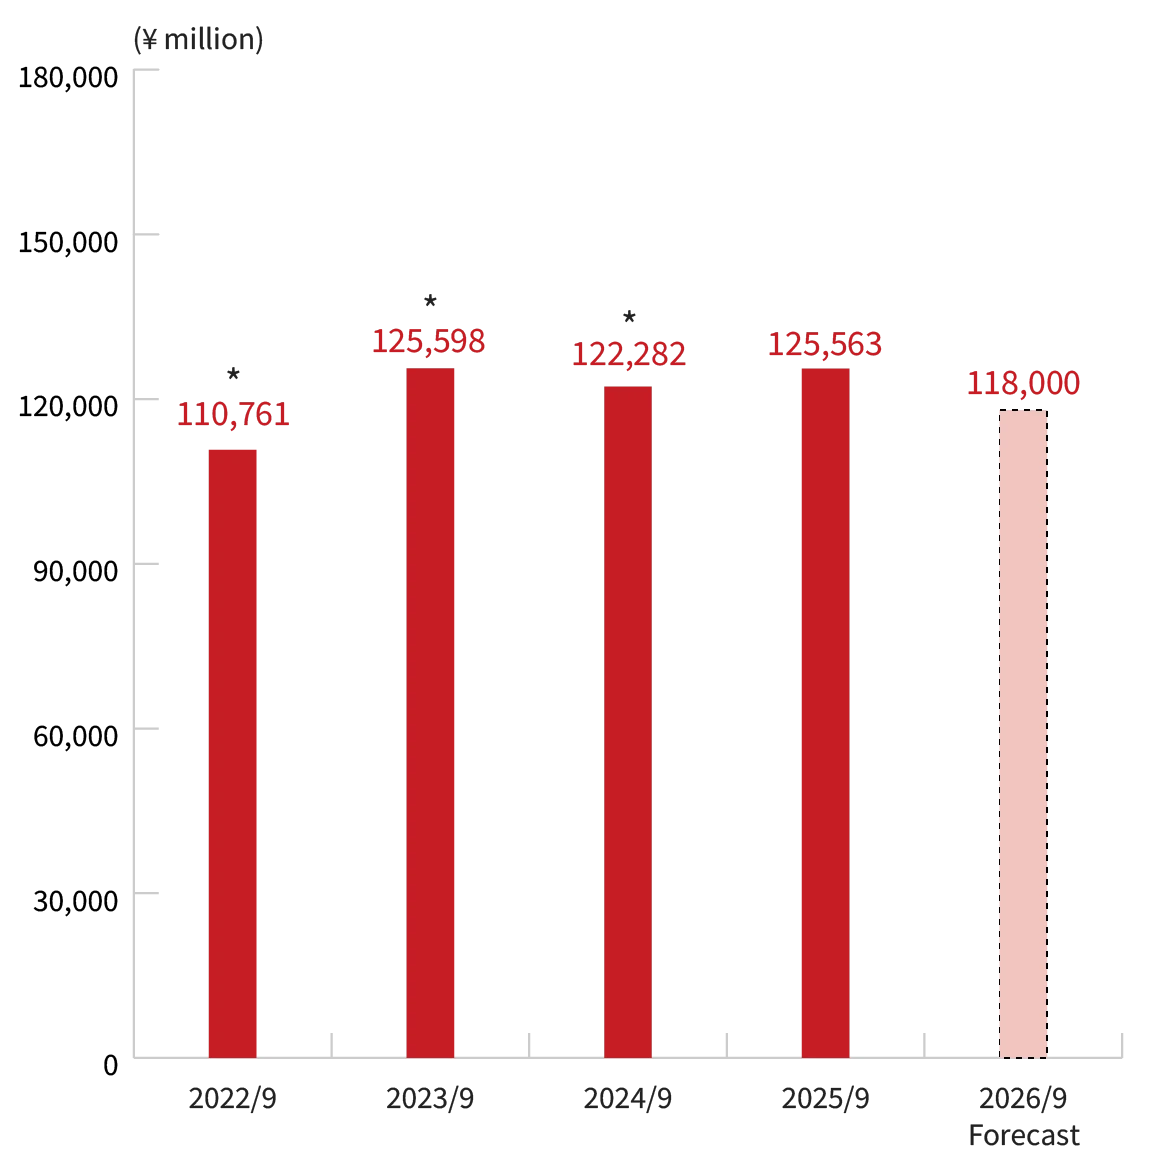
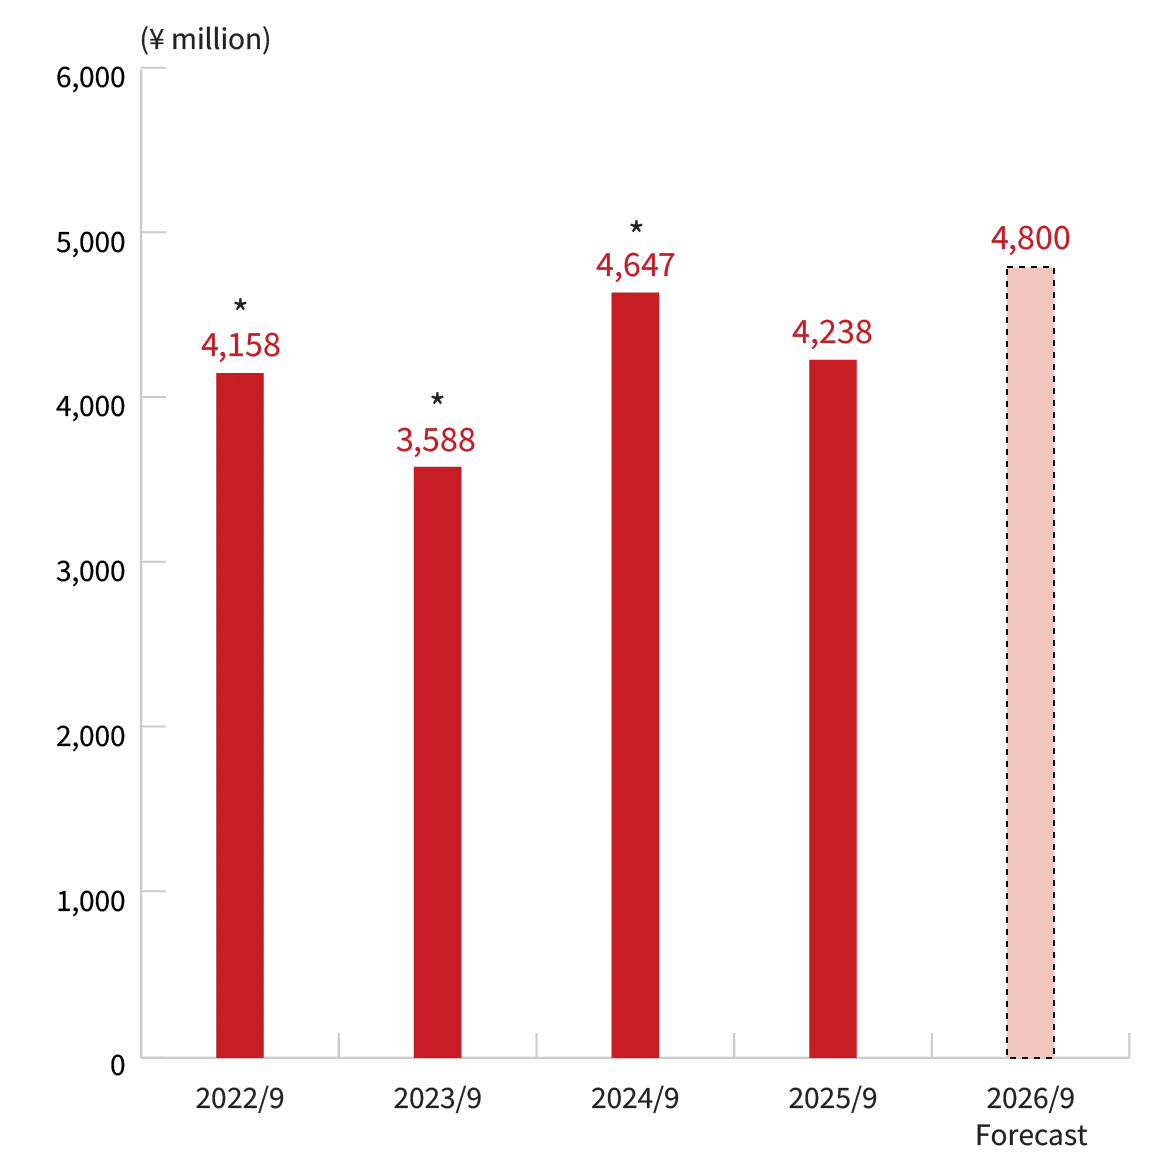
*The figures reflect the "Revisions to Securities Reports and Financial Statements, etc. for past years" announced on January 6, 2025.
Net Sales
Operating Income
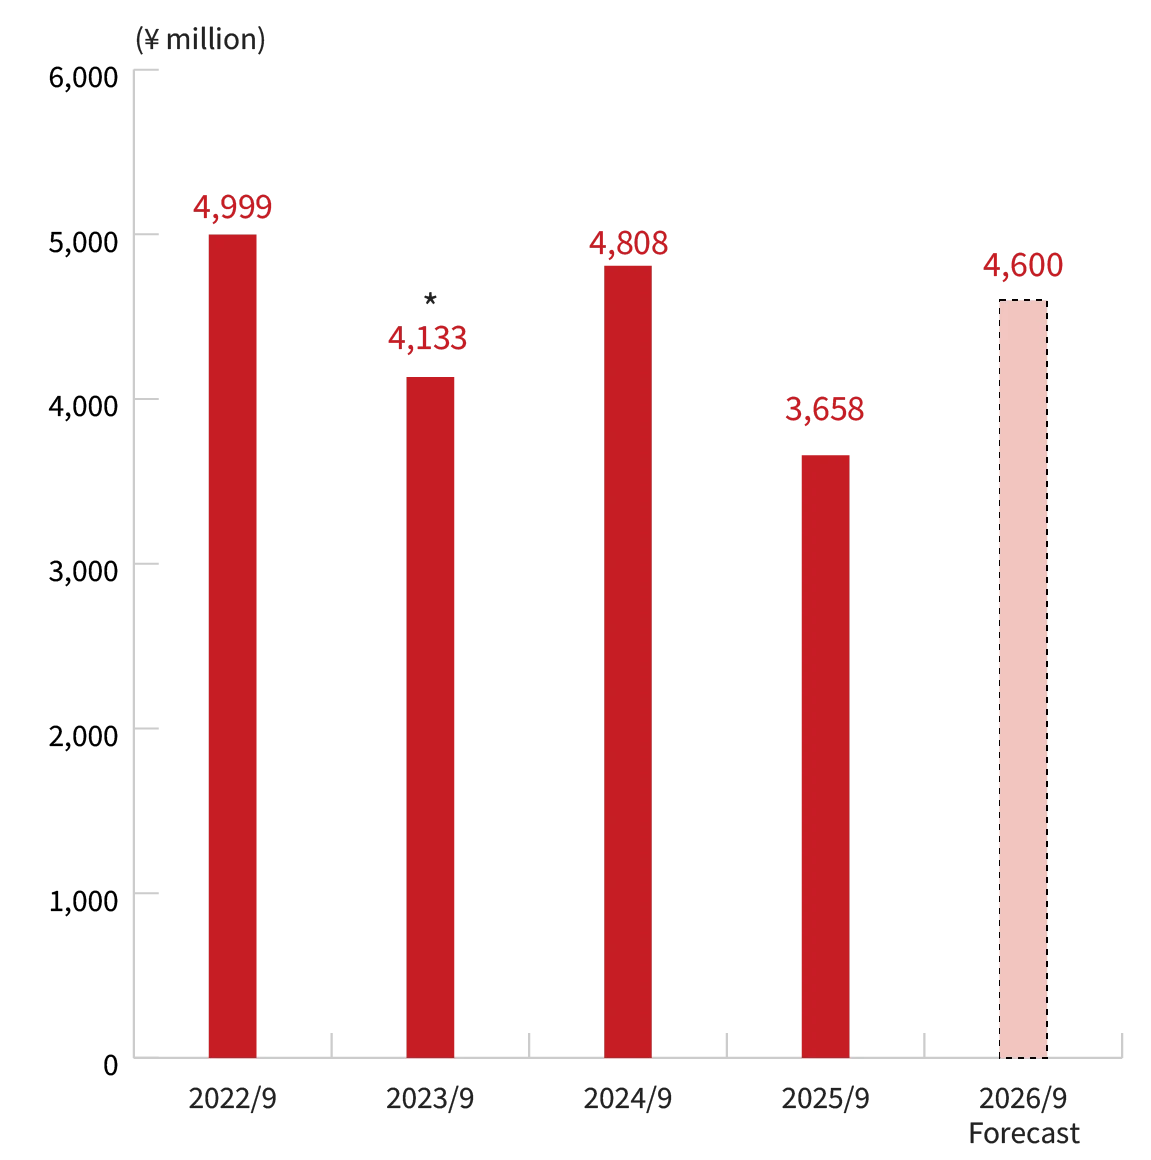
Ordinary Income
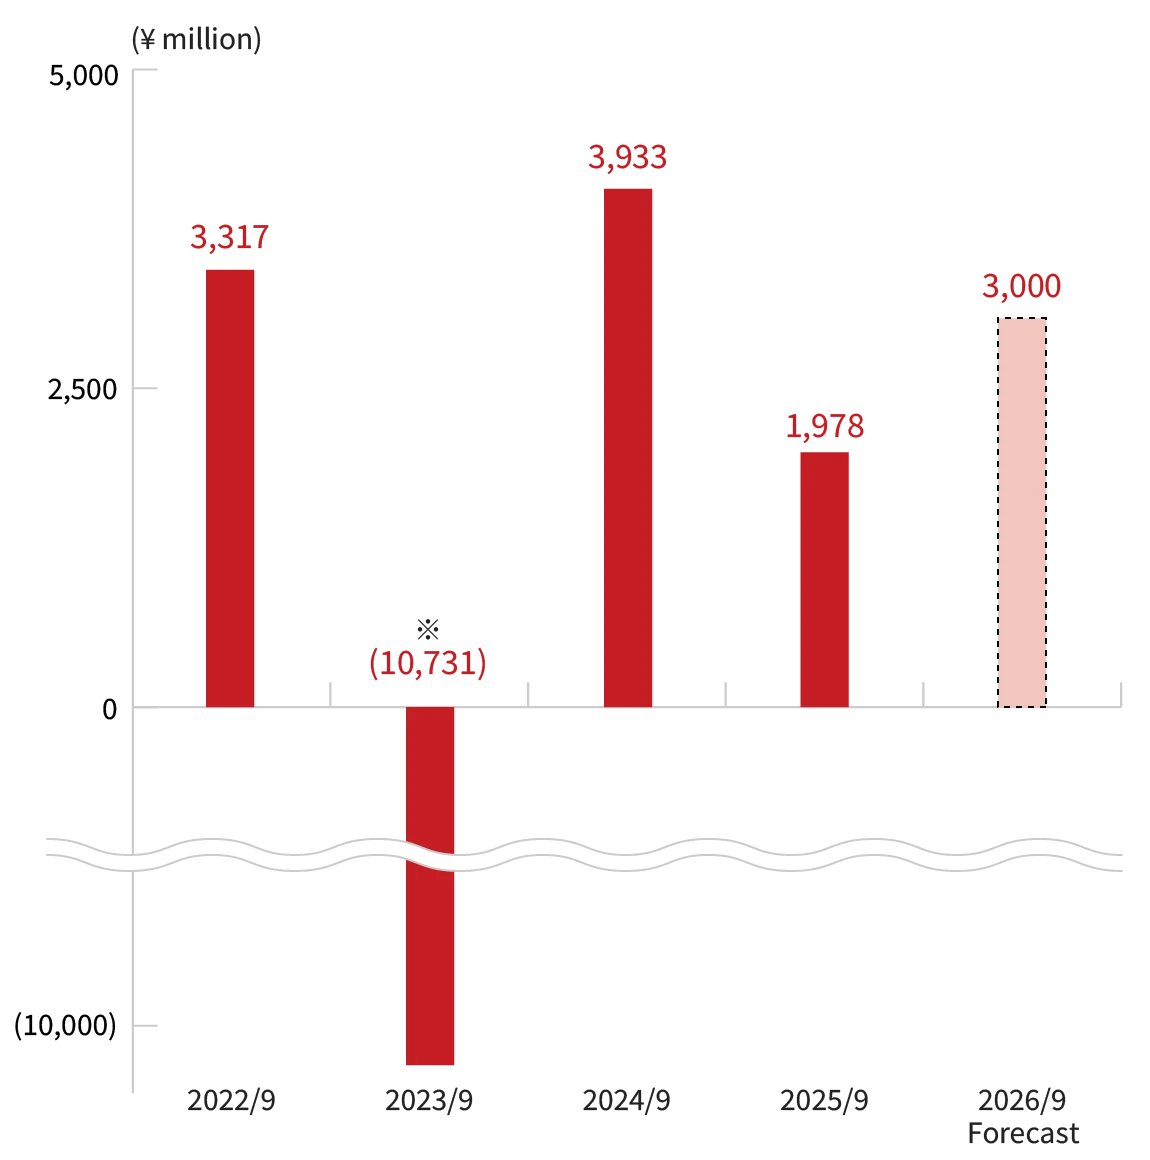
Net Income
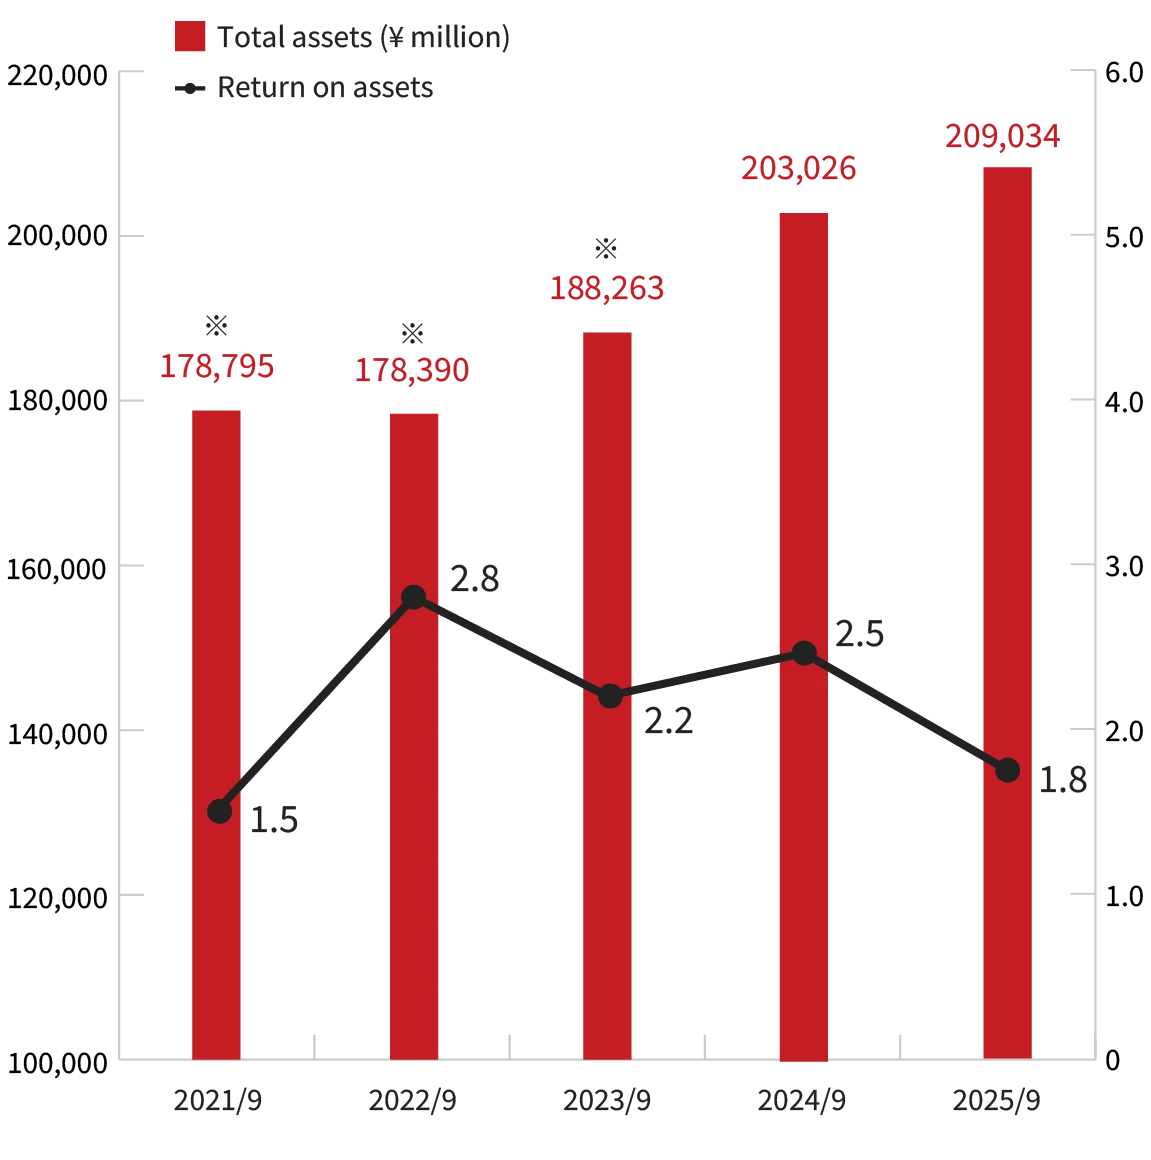
Total Assets / Return On Assets
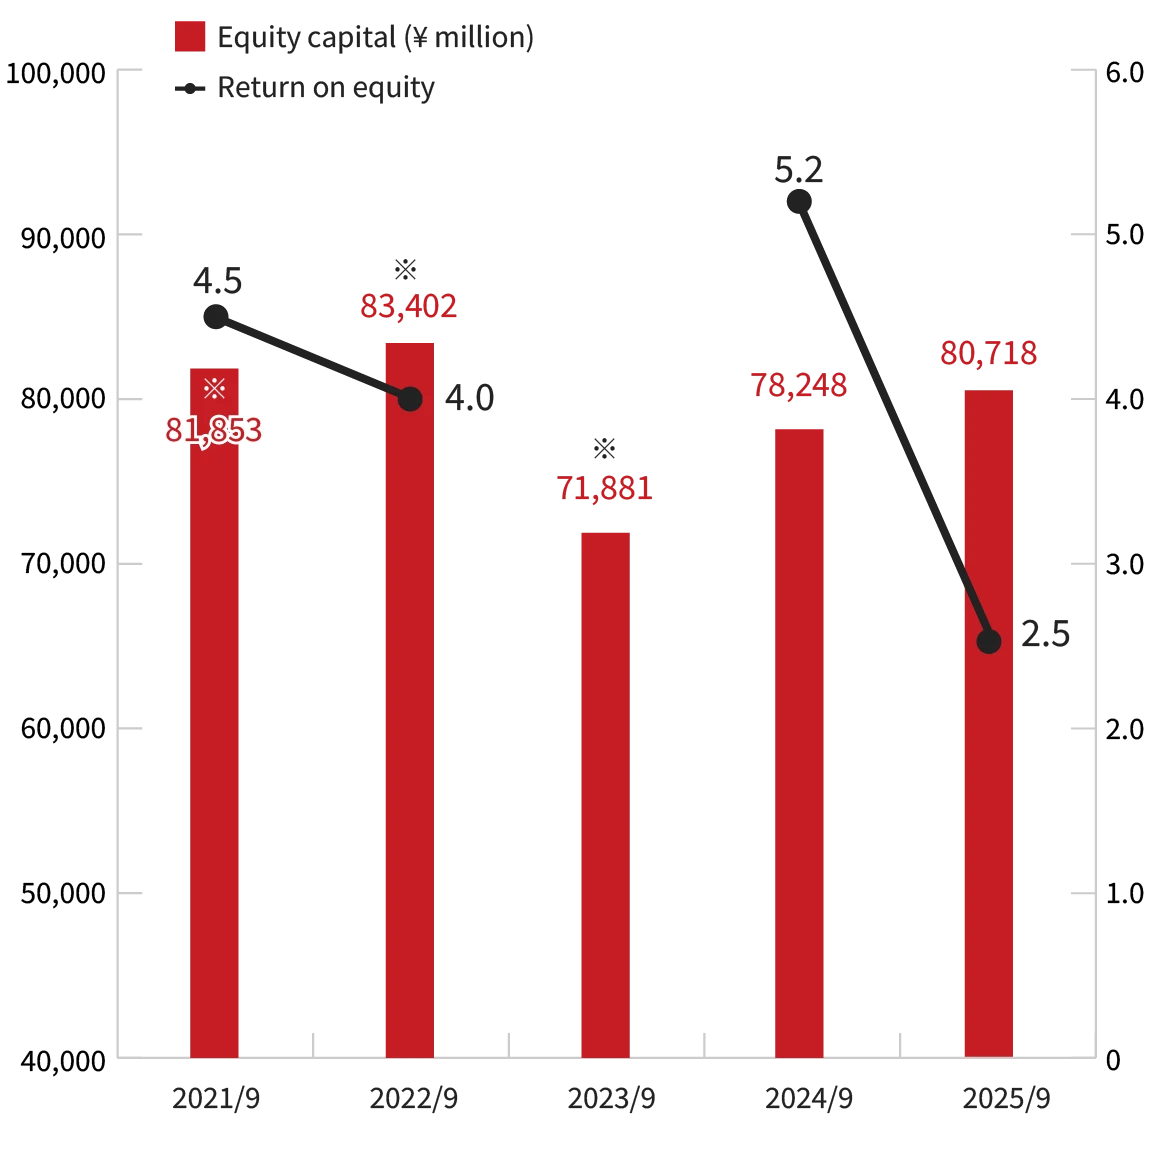
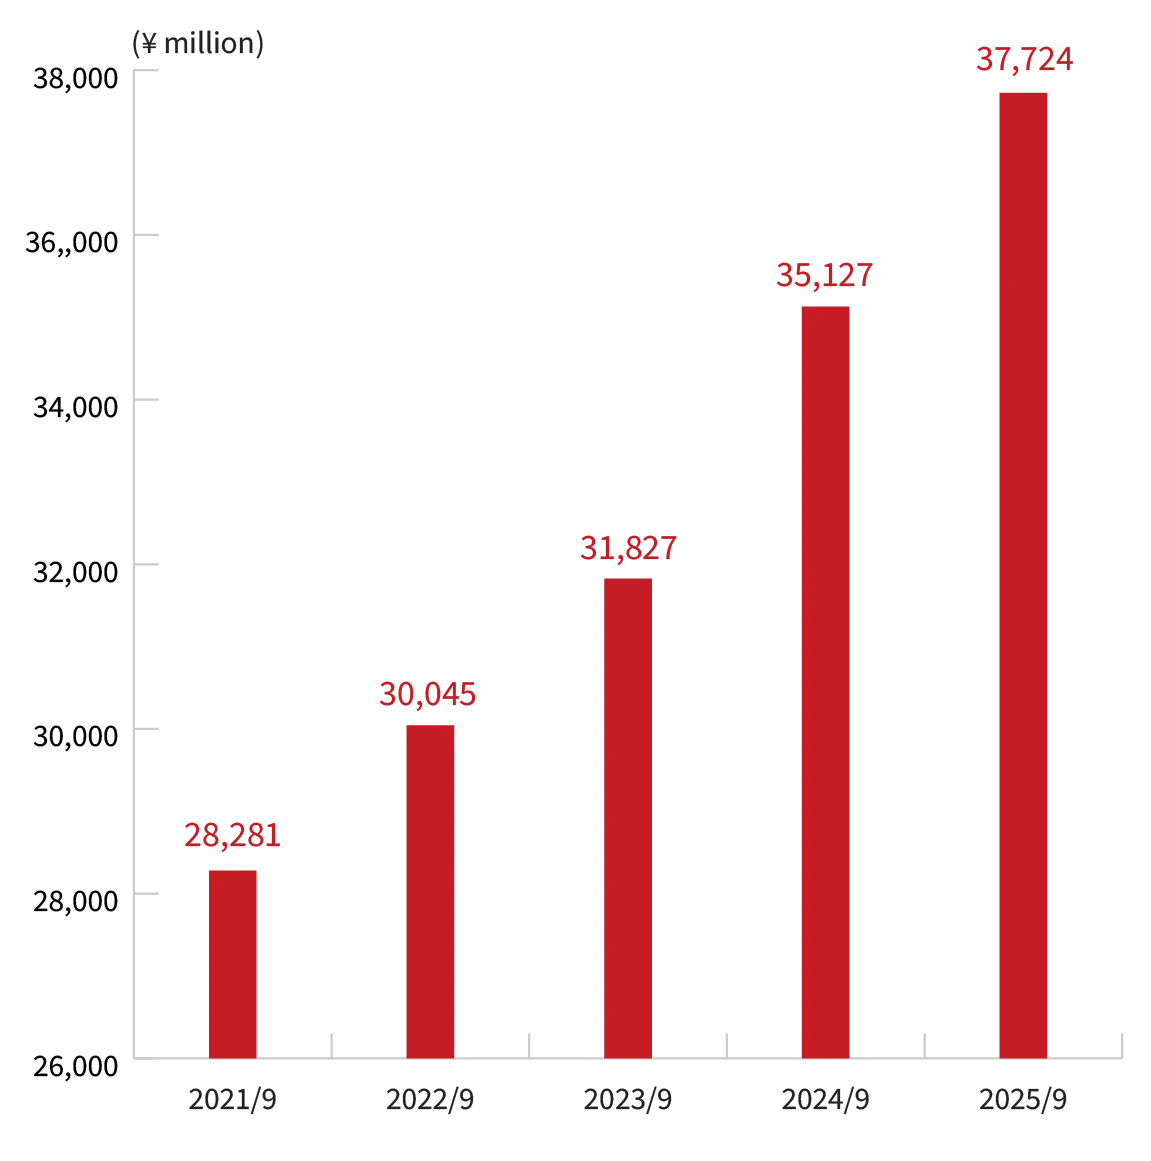
Equity Capital / Return On Equity
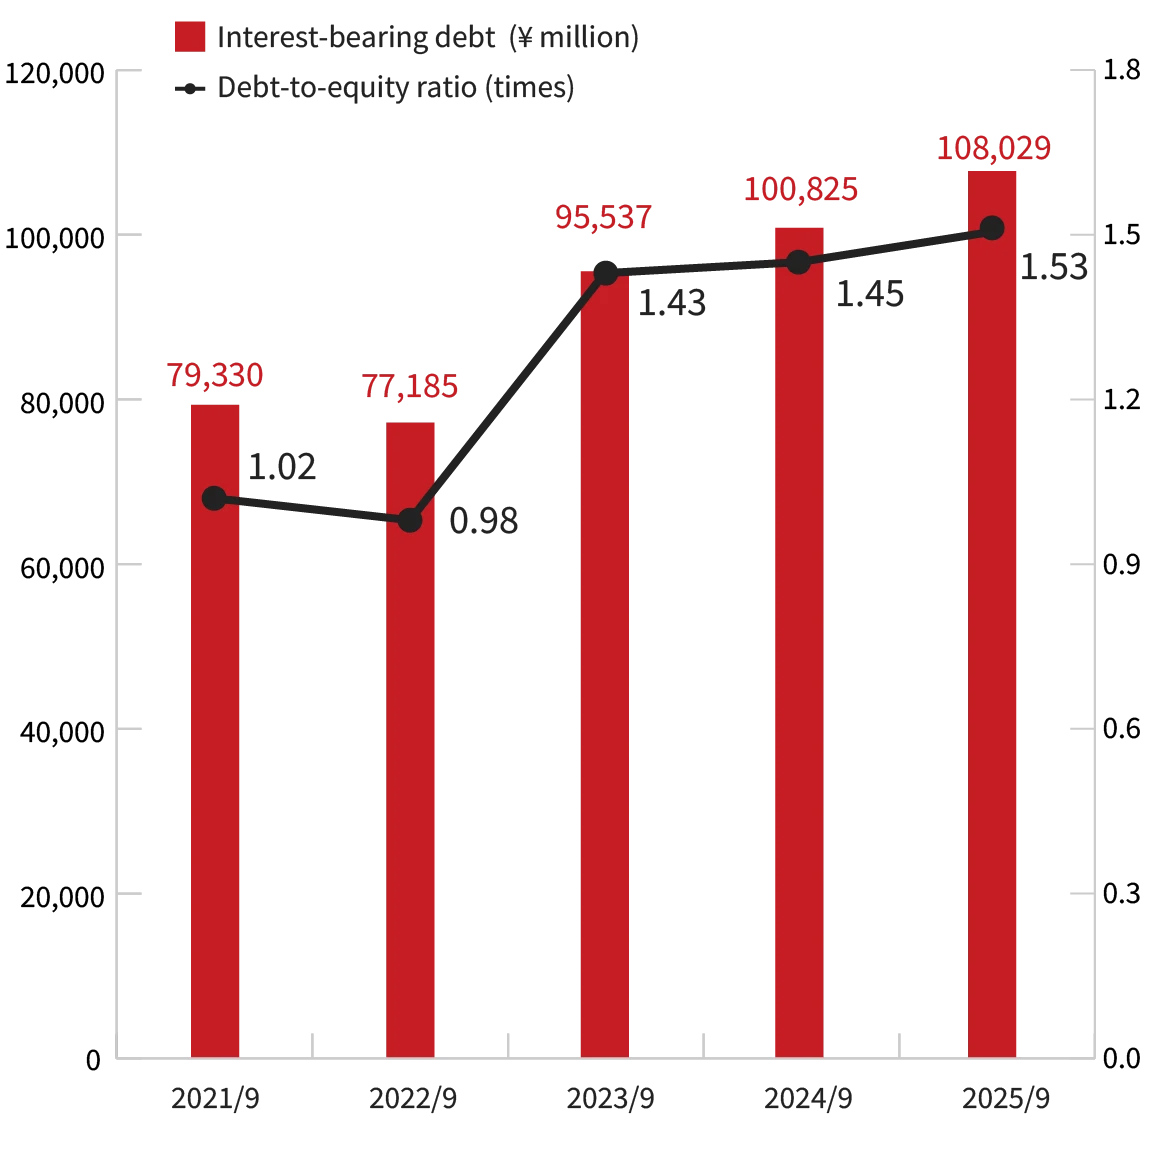
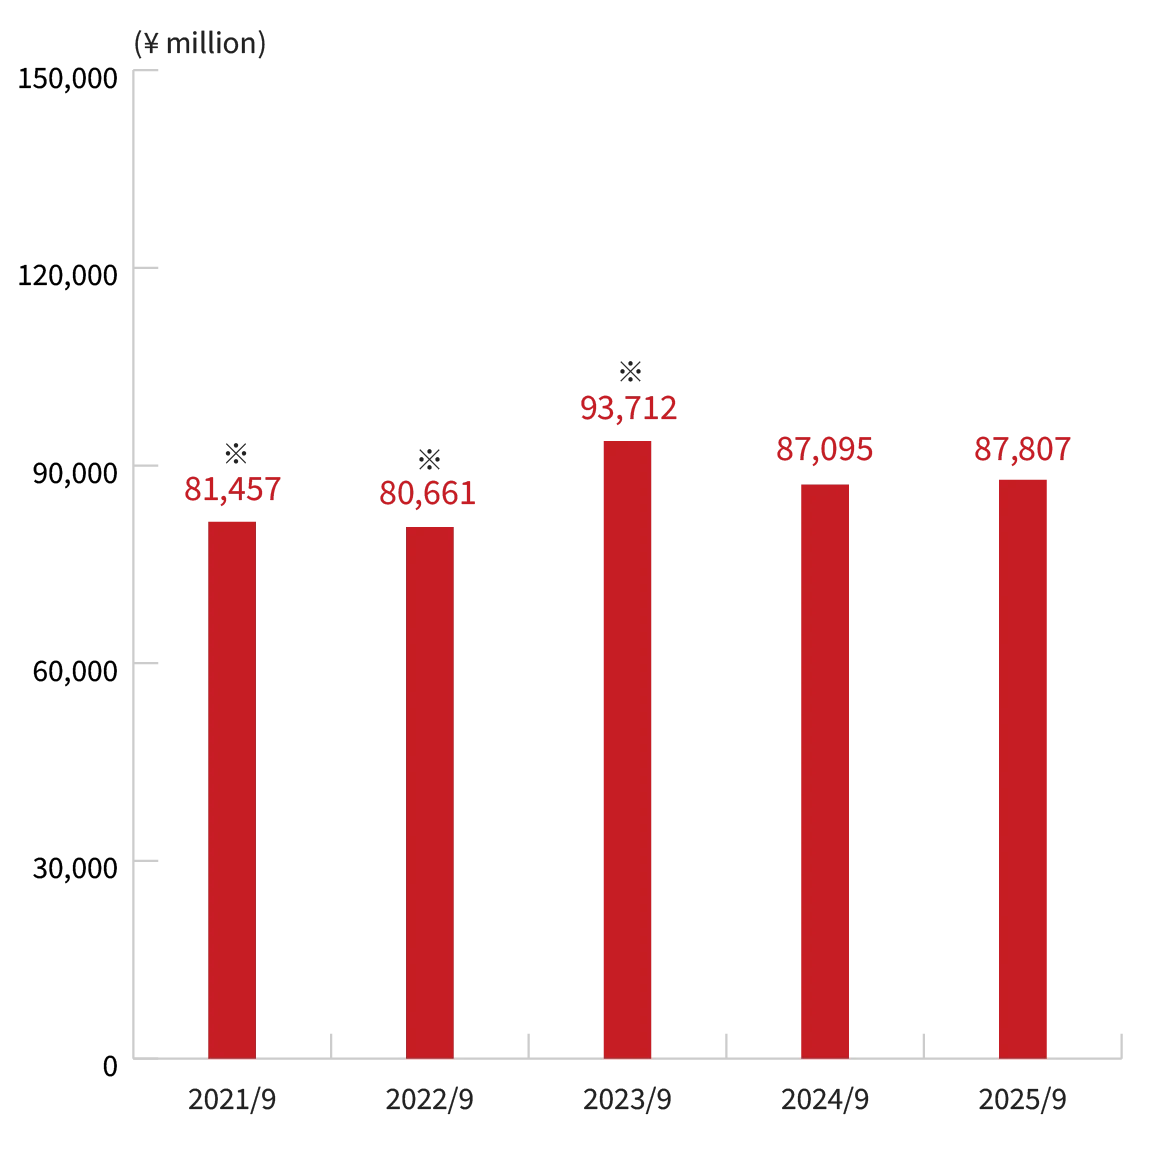
Interest-bearing Debt / Dept-to-equity Ratio (times)
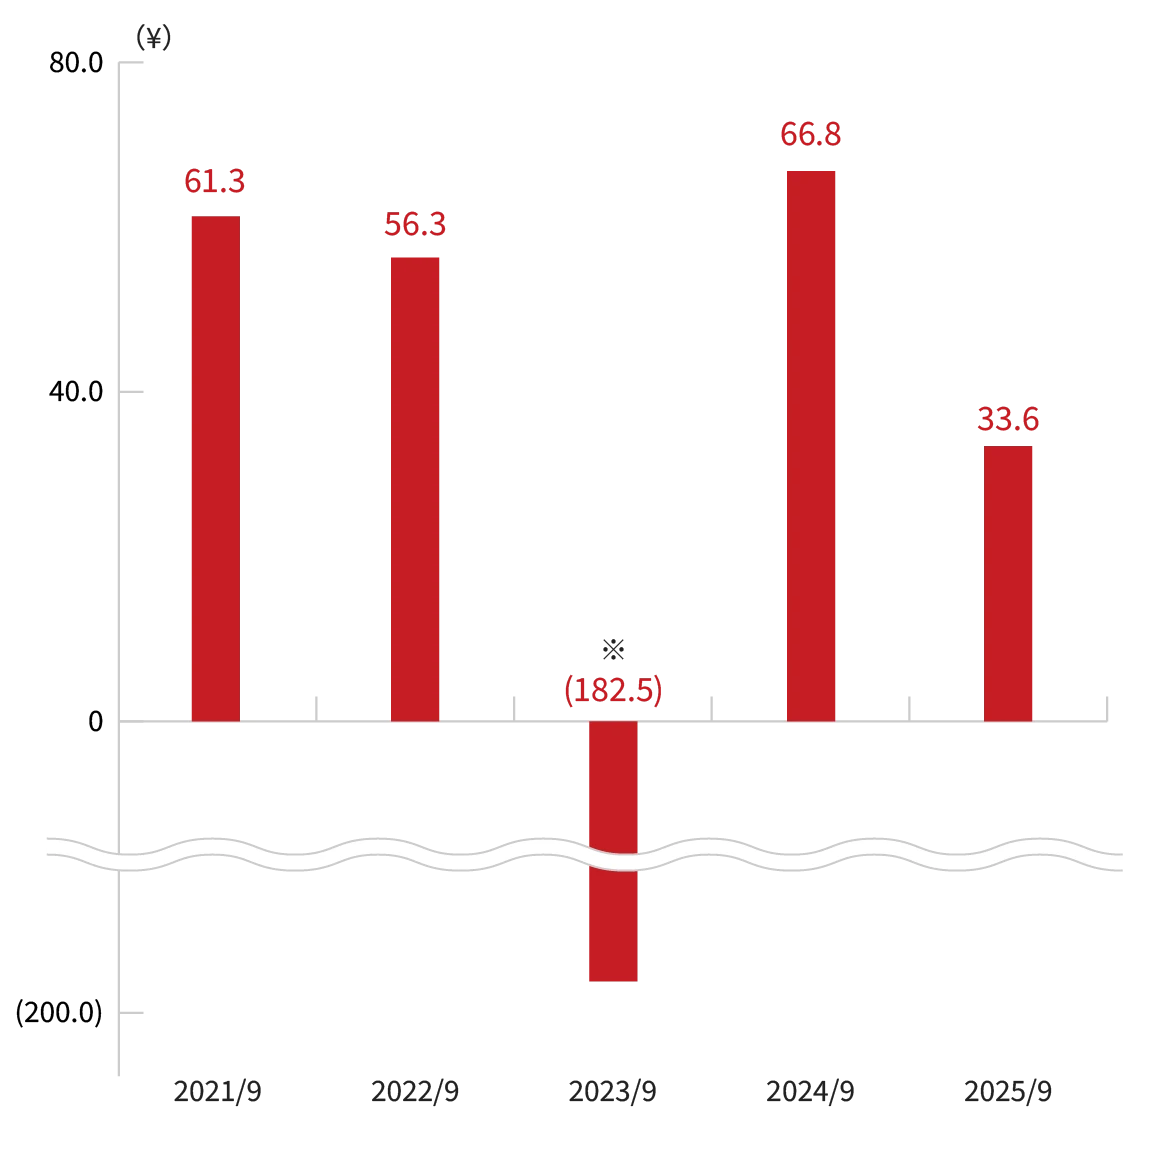
Net Income per Share
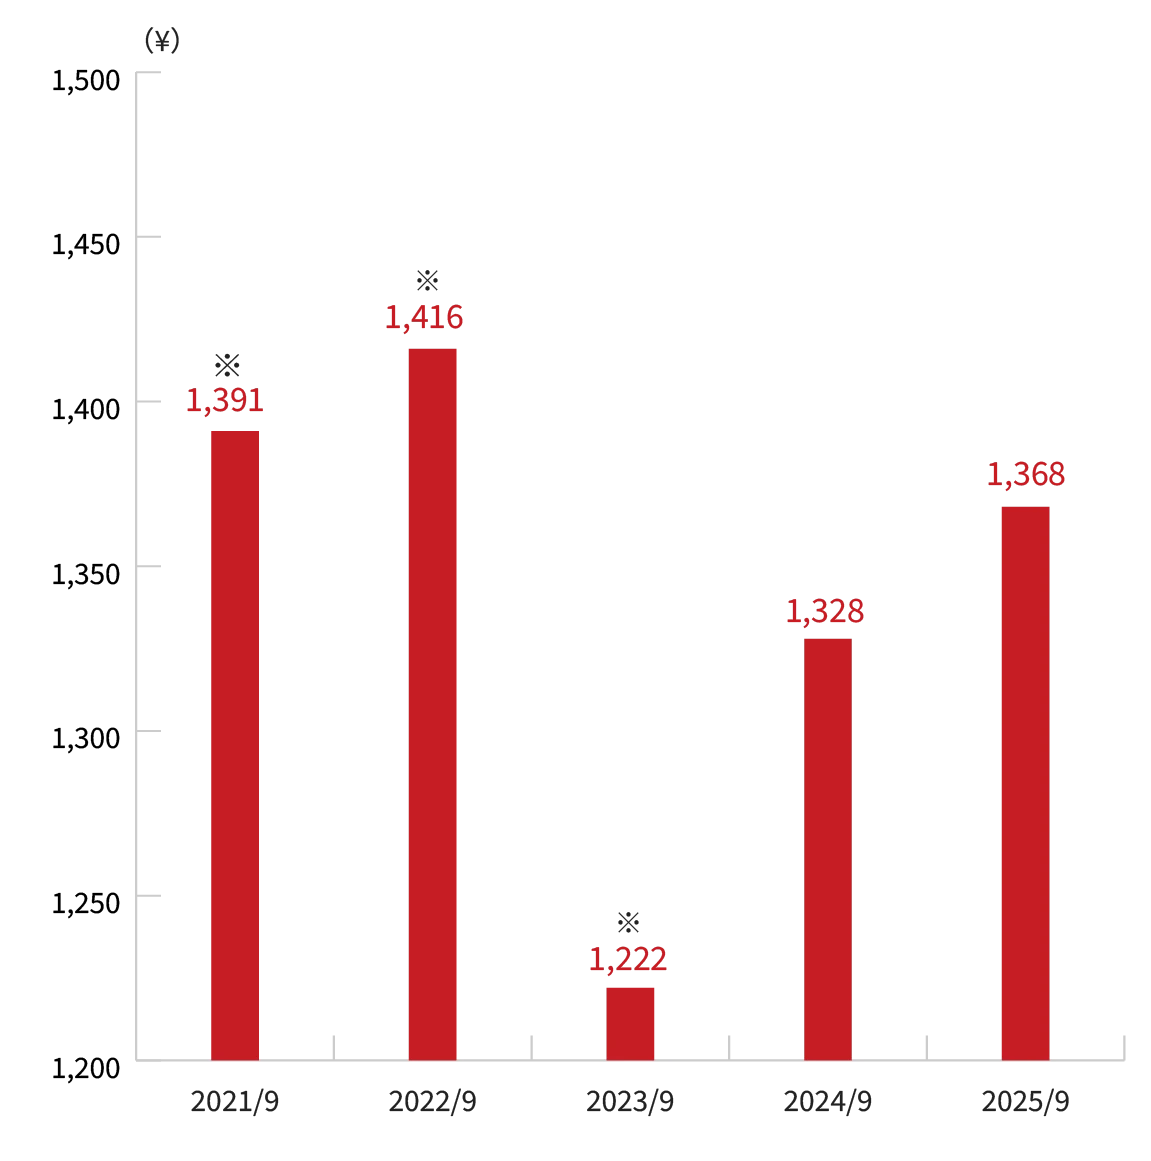
Net Assets per Share
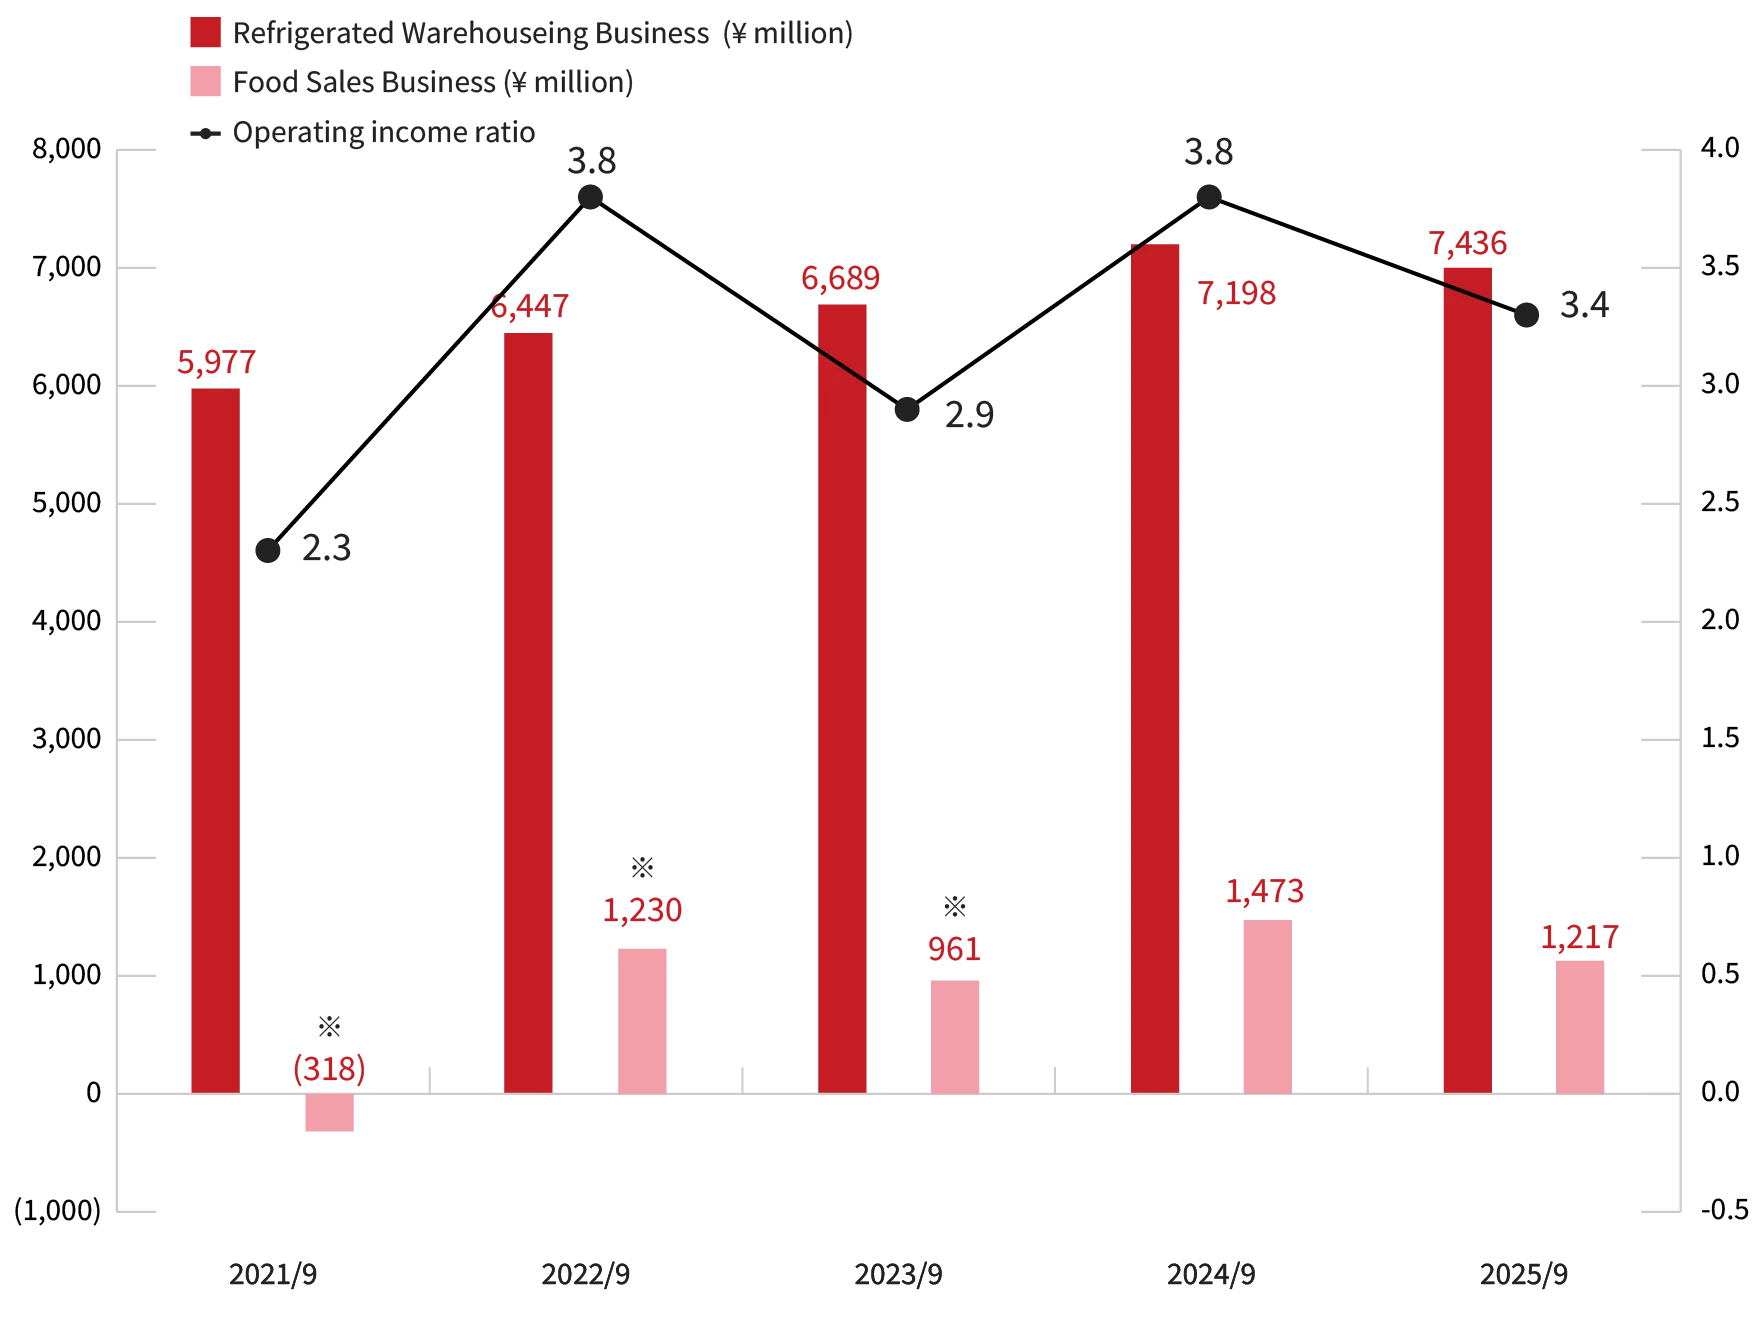
Refrigerated Warehousing Business
Food Sales Business
Operating Income by Business Segment
| ¥ million | 2025 | 2024 | 2023 | 2022 | 2021 | 2020 | 2019 | 2018 | 2017 | 2016 | 2015 |
|---|---|---|---|---|---|---|---|---|---|---|---|
| Net sales, operating income, and net income*1 | |||||||||||
| Net sales | 125,563 | 122,282 | 125,598 | 110,761 | 109,794 | 115,025 | 139,970 | 171,772 | 159,045 | 148,609 | 154,767 |
| EBITDA | 12,501 | 12,012 | 10,169 | 10,571 | 9,235 | 9,449 | 10,459 | 9,880 | 9,879 | 9,407 | 8,339 |
| Operating income | 4,238 | 4,647 | 3,588 | 4,158 | 2,547 | 3,412 | 4,774 | 4,825 | 5,179 | 5,169 | 3,874 |
| Net income | 1,978 | 3,933 | (10,731) | 3,317 | 3,605 | 2,340 | 3,385 | 3,343 | 3,360 | 2,932 | 2,517 |
| Profitability ratios | |||||||||||
| Operating income ratio (%) | 3.4 | 3.8 | 2.9 | 3.8 | 2.3 | 3.0 | 3.4 | 2.8 | 3.3 | 3.5 | 2.5 |
| Return on sales (%) | 1.6 | 3.2 | (8.5) | 3.0 | 3.3 | 2.0 | 2.4 | 1.9 | 2.1 | 2.0 | 1.6 |
| Gross profit margin (%) | 11.3 | 11.2 | 10.1 | 11.3 | 12.6 | 12.1 | 10.8 | 8.8 | 9.2 | 8.4 | 7.4 |
| SGA ratio (%) | 7.9 | 7.4 | 7.2 | 7.5 | 10.2 | 9.1 | 7.4 | 6.0 | 5.9 | 4.9 | 4.9 |
| Total assets, total shareholders’ equity, and interest-bearing debt |
|||||||||||
| Total assets | 209,034 | 203,026 | 188,263 | 178,390 | 178,795 | 179,935 | 179,247 | 186,791 | 173,699 | 145,232 | 118,901 |
| Total shareholders’ equity | 70,420 | 69,586 | 66,987 | 79,157 | 77,550 | 75,248 | 74,122 | 72,181 | 64,369 | 61,130 | 59,228 |
| Net assets | 82,417 | 79,871 | 73,340 | 84,768 | 83,021 | 79,975 | 80,580 | 78,858 | 69,688 | 63,027 | 62,322 |
| Interest-bearing debt | 108,029 | 100,825 | 95,537 | 77,185 | 79,330 | 82,346 | 79,949 | 89,478 | 83,845 | 63,927 | 42,789 |
| Shareholders’ equity ratio (%) | 38.6 | 38.5 | 38.2 | 46.8 | 45.8 | 43.2 | 43.7 | 41.5 | 39.4 | 42.7 | 51.6 |
| Debt/Equity ratio (%) | 153.4 | 144.9 | 142.6 | 97.5 | 102.3 | 109.4 | 107.9 | 124.0 | 130.3 | 104.6 | 72.2 |
| Capital expenditures and depreciation | |||||||||||
| Capital expenditures | 16,900 | 21,554 | 12,378 | 7,068 | 13,744 | 15,513 | 12,479 | 11,960 | 10,210 | 12,721 | 4,556 |
| Depreciation | 8,263 | 7,365 | 6,581 | 6,413 | 6,688 | 6,037 | 5,685 | 5,054 | 4,699 | 4,237 | 4,465 |
| Return indicators | |||||||||||
| Return on equity (ROE) (%) | 2.5 | 5.2 | — | 4.0 | 4.5 | 3.0 | 4.3 | 4.6 | 5.1 | 4.8 | 4.2 |
| Return on total assets (ROA) (%) | 1.0 | 2.0 | (5.9) | 1.9 | 2.0 | 1.3 | 1.8 | 1.9 | 2.1 | 2.2 | 2.2 |
| Investment indicators | |||||||||||
| Price/Earnings ratio — PER (times) | 36.20 | 14.21 | — | 15.64 | 14.47 | 22.91 | 17.92 | 15.45 | 16.49 | 18.92 | 19.34 |
| Price/Book value ratio — PBR (times) | 0.89 | 0.71 | 0.99 | 0.62 | 0.64 | 0.69 | 0.77 | 0.70 | 0.82 | 0.89 | 0.79 |
| Price/Cash flow ratio — PCFR (times) | 6.84 | 5.99 | (16.88) | 5.34 | 5.35 | 6.13 | 6.76 | 6.43 | 7.41 | 7.92 | 7.08 |
| Per share value indicators | |||||||||||
| Net income per share (EPS) (¥) | 33.56 | 66.79 | (182.52) | 56.34 | 61.30 | 39.86 | 57.77 | 59.63 | 64.28 | 56.66 | 48.66 |
| Book value per share (BPS) (¥) | 1,368.24 | 1,327.75 | 1,222.23 | 1,416.00 | 1,391.29 | 1,321.34 | 1,336.12 | 1,321.87 | 1,298.88 | 1,198.56 | 1,185.23 |
| Cash flow per share (CFPS) (¥) | 177.62 | 158.37 | (71.73) | 164.85 | 165.71 | 148.95 | 153.17 | 143.25 | 143.05 | 135.39 | 132.89 |
| Dividends and payout ratio | |||||||||||
| Dividends per share (¥) | 24.00 | 24.00 | 24.00 | 23.00 | 23.00 | 23.00 | 23.00 | 23.00 | 20.00 | 20.00 | 20.00 |
| Payout ratio (%) | 71.5% | 35.9 | — | 40.8 | 37.5 | 57.7 | 39.8 | 38.6 | 31.1 | 35.3 | 41.1 |
(As of November 13, 2025)
■ Methods of Calculating Main Financial Indicators
EBITDA = Operating income + Depreciation
Operating income ratio = Operating income/Net sales ×100
Return on sales = Net income/Net sales ×100
Gross profit margin = Gross profit/Net sales ×100
SGA ratio = Selling, general and administrative expenses/Net sales ×100
Shareholders’ equity ratio = Total shareholders’ equity/Total assets ×100
Debt/Equity ratio = Interest-bearing debt/Shareholders’ equity ×100
Return on equity (ROE) = Net income/Average shareholders’ equity ×100
Return on total assets (ROA) = Net income/Average total assets ×100
Cash flow per share (CFPS) = (Net income + Depreciation and amortization + Deferred income tax)/Outstanding shares
*1 Net income on this page represents profit attributable to owners of parent
*2 Figures reflect the “Corrections to Securities Reports and Financial Results for Previous Fiscal Years” disclosed on January 6, 2025.